First, need to configure the mail service in your grafana ini file.
Open /etc/grafana/grafana.ini file and go to [smtp] setup line and configure our mailing system details, like SMTP, Port number, Username and password. Once finished restart the grafana service.
1. CPU Alert configurations:
systemctl restart grafana-server
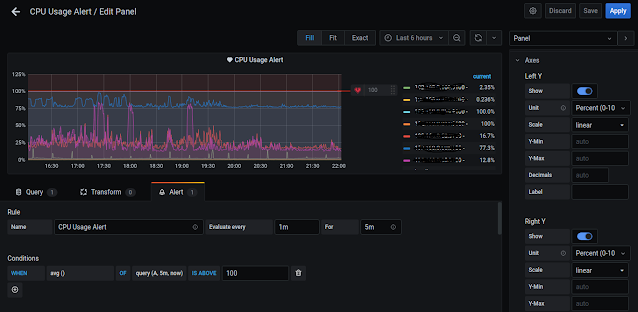
1. Go to Query tab: Listed A row, select Metrics, write query
(100 - ( avg by ( instance ) ( rate ( node_cpu_seconds_total{mode='idle'}[1m] ) ) * 100 )
Legend if mention {{instance}} - For show only IP or URL in graph page, leave empty means list full details and need variable you can call in Legend, but be mentioned like {{$VARIABLE}}.
2. Go to Alert tab :
Rule Name for Alert display name in grafana Alert page.
Conditions for alert when needs to trigger
Notifications for select your mail channel. [ Not created go to Alert --> created channel and then add mail id's ]
* Important: Before save this conditions
Go to right side panel select Axes option:
Left Y - Unit Percent(0-100)
Scale - linear
Right Y - Unit Percent(0-100)
Scale - linear
Now apply and save the panel, it's take 2 to 5 minuts to apply conditions and confirm your alert configurations go to Alert and check you Alert health green or red.
2. Disk Alert configurations in GB based:
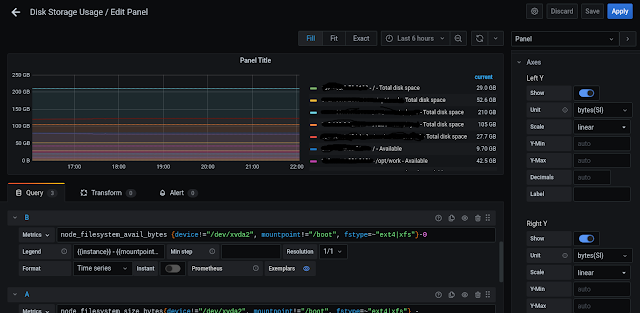
Add new panel row for disk alert and select Query tab
A Row for used disk space query:
node_filesystem_size_bytes{device!="/dev/xvda2", mountpoint!="/boot", fstype=~"ext4|xfs"} -
node_filesystem_free_bytes{fstype=~"ext4|xfs"}
Above query != means don't include /dev/xvda2 and /boot partitions
We calculated total filesystem - free filesystem = Used filesystem
Legend {{instance}} - {{mountpoint}} - Used space
B Row for Available disk space query:
node_filesystem_avail_bytes {device!="/dev/xvda2", mountpoint!="/boot", fstype=~"ext4|xfs"}-0
Legend {{instance}} - {{mountpoint}} - Available space
C Row for total filesystem query:
node_filesystem_size_bytes{device!="/dev/xvda2", mountpoint!="/boot", fstype=~"ext4|xfs"}-0
Legend {{instance}} - {{mountpoint}} - Total space
Alert in percentage
100 - (100 * ((node_filesystem_avail_bytes{device!="/dev/xvda2", mountpoint!="/boot", fstype=~"ext4|xfs"} ) / (node_filesystem_size_bytes{device!="/dev/xvda2", mountpoint!="/boot", fstype=~"ext4|xfs"}) ))
Legend {{instance}} - {{mountpoint}} - Used space
2. Go to Alert tab :
Rule Name for Alert display name in grafana Alert page.
Conditions for alert when needs to trigger
Notifications for select your mail channel
This steps for - Percentage
Go to right side panel select Axes option:
Left Y - Unit Percent(0-100)
Scale - linear
Right Y - Unit Percent(0-100)
Scale - linear
This steps for - GB
Left Y - bytes(SI)
Scale - linear
Right Y - bytes(SI)
Scale - linear
3. Disk Alert configurations in GB based:
1. Add new panel row for disk alert and select Query tab
A Row for Available Memory query:
node_memory_MemAvailable_bytes
Legend {{job}} - Available
B Row for used Memory query:
node_memory_MemTotal_bytes - node_memory_MemAvailable_bytes
Here total memory - available memory = used memory calculated
Legend {{job}} - Used
C Row for total Memory query:
node_memory_MemTotal_bytes
Legend {{job}} - Total
You can change the Row order.
2. Go to Alert tab :
Rule Name for Alert display name in grafana Alert page.
Conditions for alert when needs to trigger
Notifications for select your mail channel
This steps for - Percentage type
Go to right side panel select Axes option:
Left Y - Unit bytes(SI)
Scale - linear
Right Y - Unit bytes(SI)
Scale - linear


No comments: